Saturday, April 30, 2016

Using Python3

Do you need to start a virtual environment with python 3 instead of python 2.x? I'll show you how.

I am not going to show you how to change the python version of an existing virtual environment today, so if you have already started a virtual environment in python 2.x, please delete it and create a new one from scratch using the directions below.

First, let's make sure we have python3 installed. Check where your python3 is located:
which python3

A path should come up. However, if your system can't find it, that means you don't have it installed. Use Homebrew (brew install python3) and you should be good to go.

Now that we know where our python3 is installed, let's create a virtual environment that uses python3.

mkvirtualenv mycoolenv -p /usr/local/bin/python3

As you can see above, my python3 was located at /usr/local/bin/python3, but substitute yours with your particular path.

And there you have it! You have now created a virtual environment called mycoolenv that will use python3.


Python Collections & Recollections

I collected lots of stuff as a kid—mainly rocks, pencils, bouncy balls, postal stamps and stickers. Now that I live in a tiny apartment, I don't have anywhere to hoard keep any collections.

Do you feel my pain? Do you want more collections in your life? Well, good news: no matter how small your space is, you always have room to squeeze Python's collections module into your life. The documentation is very thorough, so I suggest you check it out. What follows is a more beginner friendly intro to collections if you've never used this module before.

from collections import Counter


No counter space in your kitchen? That's unfortunate. In Python, you'll always have space to import counter objects! Just type from collections import Counter and you're good to go.

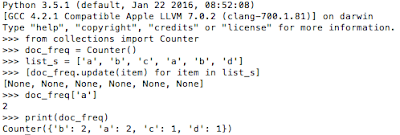
After you create a Counter object with Counter(), you can update that object with items from a list, and it will create a dictionary that stores that items of that list as keys and the number of times that item appears. You can also add two counter objects:
>>> c = Counter(a=3, b=1)
>>> d = Counter(a=1, b=2, c=1)
>>> c+d

Counter({'a': 4, 'b': 3, 'c': 1})

It's like having Count von Count on speed dial.

Count von Count to the rescue!

from collections import defaultdict
defaultdict is awesome! You can initialize it as a an int if you want to count stuff, or as a list if you want to keep appending items.

That means instead of:
def create_record(list1):
    """Iterate through list1 and return a dictionary, final_dict, which has all items from list1 as keys, and their frequencies as values.
    """
    final_dict = dict()
    for item in list1:
        if final_dict[item]:
            final_dict[item] += 1
        else:
            final_dict[item] = 1
    return final_dict

You can just write:
from collections import defaultdict
def create_record(list1):
    """Iterate through list1 and return a dictionary, final_dict, which has all items from list1 as keys, and their frequencies as values.
    """
    final_dict = defaultdict(int)
    for item in list1:
        final_dict[item] += 1
    return final_dict


from collections import OrderedDict
An OrderedDict allows you to maintain a dictionary that is ordered by its keys or values.
Let's pretend for a sec that we are in charge of inventory for a Peanuts store.

>>> from collections import OrderedDict
>>> my_dict = {'snoopy': 100, 'woodstock': 22, 'charlie_brown': 35, 'lucy': 60, 'linus': 77, 'belle': 101}
>>> OrderedDict(sorted(my_dict.items(), key=lambda k: k[0]))
OrderedDict([('belle', 101), ('charlie_brown', 35), ('linus', 77), ('lucy', 60), ('snoopy', 100), ('woodstock', 22)])
>>> OrderedDict(sorted(my_dict.items(), key=lambda k: k[1]))

OrderedDict([('woodstock', 22), ('charlie_brown', 35), ('lucy', 60), ('linus', 77), ('snoopy', 100), ('belle', 101)])
>>> OrderedDict(sorted(my_dict.items(), key=lambda k: k[1], reverse=True))
OrderedDict([('belle', 101), ('snoopy', 100), ('linus', 77), ('lucy', 60), ('charlie_brown', 35), ('woodstock', 22)])


By using OrderedDict, we can quickly see which characters we have, ordered alphabetically (lambda k: k[0]), or ordered by how much inventory of each character we have (lambda k: k[1]). You can sort it the other way by adding "reverse=True".

Snoopy thinks he has the upper hand, but he has no idea that Belle is beating him in our OrderedDict.

Now the time has come for you to experiment with collections on your own. Have fun!
Wednesday, March 23, 2016

How to convert JSON to CSV in Python

If you ever need to find out how to convert JSON information to a CSV file for some reason, check out my gist here.

Saturday, February 13, 2016

NYC Open Data project: NYC Health Inspections

Since moving to New York in 2009, I've had a mouse or roach problem in 2 out of 3 of my apartments. Am I dirty, or is it just this city? I prefer to believe the latter. Call me a hypocrite, but I would think twice about eating in a restaurant that had the same problem. I have definitely eaten at questionable places before, and I don't think that cleanliness is necessarily the most important factor when choosing a restaurant. Some of the best food on this Earth is served out of hole-in-the-wall joints. So take the following project with a grain of salt.

Ignorance is bliss, but I was very interested when NYC opened up the data from its restaurant inspections. While scanning the rows, I noticed that a good number of restaurants had violated my most feared codes: 04L ("Evidence of mice or live mice") and 04M ("Live roaches present") but still managed to earn an "A" grade at some point. Since restaurants get two chances to earn an A grade, it's possible that a restaurant might have cleaned up its act and may not have earned the A grade in the same inspection where the mice or roaches were spotted. The number of points docked for one of these violations is not enough to knock a grade down to a B in and of itself. The restaurant must commit other violations in order to be given a B or lower grade. 

For people who share the same fear of tiny little critters, I made this little app to help people see the lists of the restaurants in their zip code that had live roaches present during one or more inspections, but still managed to earn an "A" grade.

I don't want to punish restaurants for having a roach problem...it happens to the best of us. Plus, who knows how many restaurants have roaches, but didn't happen to get caught on the day of the inspection? I don't want this information to get blown out of proportion.

However, I believe that people should have access to information if they want it. They should be able to easily find out if roaches were spotted at any given restaurant's health inspection, and make an informed decision of whether this information bothers them or not before proceeding to eat at said establishment. That's why I created Dine Decisive.

I chose to focus on Manhattan for Dine Decisive. Today, I decided to dive into that data to explore how the five boroughs compared to each other in terms of roaches. 

At first, I queried the data in the form of JSON via their API, but I quickly realized that some restaurants (e.g. "domodomo") appeared in the portal but were missing from the JSON data. For example, I couldn't find "domodomo" when doing a quick control-F on the JSON link above. However, when I looked at the data on Socrata and searched for "domodomo," 5 results came up:


What the heck was going on?

I decided to download the data in the form of a CSV and was relieved to see that "domodomo" was in that file. 

So I suggest that you download the data in the form of a CSV rather than query the API (plus, Socrata often does maintenance on the weekends so you won't be able to access the data during certain times). You can actually see a popup about scheduled maintenance in the screenshot above.

At the top of the CSV file, you will see a helpful guide that tells you what each row means:
CAMIS,DBA,BORO,BUILDING,STREET,ZIPCODE,PHONE,CUISINE DESCRIPTION,INSPECTION DATE,ACTION,VIOLATION CODE,VIOLATION DESCRIPTION,CRITICAL FLAG,SCORE,GRADE,GRADE DATE,RECORD DATE,INSPECTION TYPE

In Python, process the csv file by writing this:

    with open(nyc_csv, 'rb') as csvfile:
        my_data = csv.reader(csvfile)
        for row in my_data:

If you run the script with the csv file in the same directory as your script, you don't need to specify a directory. nyc_csv will just be the name of your csv file as the form of a string (i.e. 'nyc_csv.csv').

Some things to note about the file:
Restaurant violations are counted as a new row every time. We don't want to add any one restaurant more than once. Therefore, I created another list called rest_ids to keep track of what restaurants I had processed so far. I wanted to count how many total restaurants there were in each borough. I did this by appending the CAMIS (row[0]) to the list of rest_ids. To account for multiple locations of the same restaurant (i.e. chains like Dunkin Donuts), I used CAMIS rather than DBA (the name of the restaurant).

I only wanted to check recent inspections, so I filtered for inspection dates in the year 2015. You can update this in the code to look for inspections from prior years, if you're interested in seeing those results instead.

The results are in...drumroll, please!


Manhattan: 788 out of 9422 (~8.36%)
Staten Island: 38 out of 828 (~4.59%)
Queens: 615 out of 5361 (~11.47%)
Brooklyn: 677 out of 5710 (~11.86%)
Bronx: 238 out of 2237 (~10.64%)

The percentage refers to the number of restaurants with roaches divided by the total number of restaurants in that borough. I divided and multiplied by 100, then rounded to 2 digits. Make sure to convert the numbers to floats before dividing.

It's interesting to see that Staten Island scored the best, and Manhattan was in 2nd place. Brooklyn fared the worst, but was only slightly worse than Queens.